Wildfire risk is not uniform across San Bernardino County. In the places we scored, overall wildfire risk runs from 21.1 up to 84.8, with a midpoint of 49.1.
We scored 202 points across San Bernardino County on the same 0–100 scale a Satelife address report uses, and they do not land in one place. 4% of them come out Very High, while 5% are Low. Which end your own parcel sits at is not something a county map can tell you.
FEMA NRI also rates San Bernardino County: all-hazards risk Very High · social vulnerability Relatively Low · community resilience Relatively Low · annualised wildfire frequency 0.0095.
Sources: FEMA National Risk Index 1.20.0 (Dec 2025), county record · USFS Wildfire Risk to Communities v2.0, mean of the grid cells inside the county. Both describe the county as a whole, never an address in it.
What does your San Bernardino County address score?
A county range shows the spread. Your parcel sits somewhere inside it — the report says where, and what to do about it.
Free to request · PDF report with a 0–100 score, the drivers behind it, and a mitigation plan
Most scored locations fall in the Moderate tier (96 points), with High close behind (87 points). There are fewer points in Low (11) and Very High (8), so buyers and owners can see very different risk levels depending on location.
FEMA’s National Risk Index rates San Bernardino County as “Very High” for wildfire risk, and also “Very High” for expected annual wildfire loss. Those are county-wide FEMA ratings, not neighborhood ratings.
Fire activity has been substantial in this county: 915,062 acres have burned since 1984, and that equals 7.1% of the county. The county has recorded 448 fire perimeters over that period.
The largest fire listed here is the York fire (2023) at 93,078 acres. The most recent large fire is Gold (2025).
Other major fires in the county record include Old (2003), which destroyed 1,003 structures, and Line (2024) at 43,976 acres. Together with fires such as Sawtooth Complex (2006), Wildhorse (2005), and Apple (2020), they show repeated large-fire exposure over time.
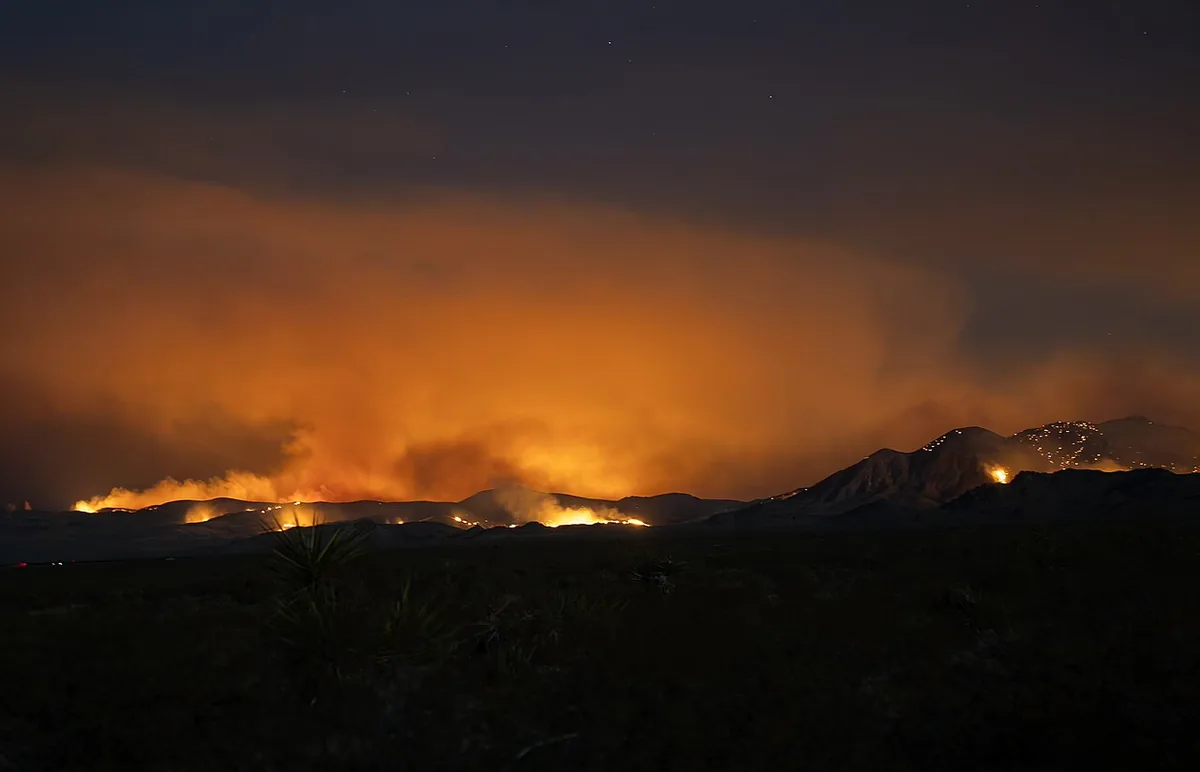
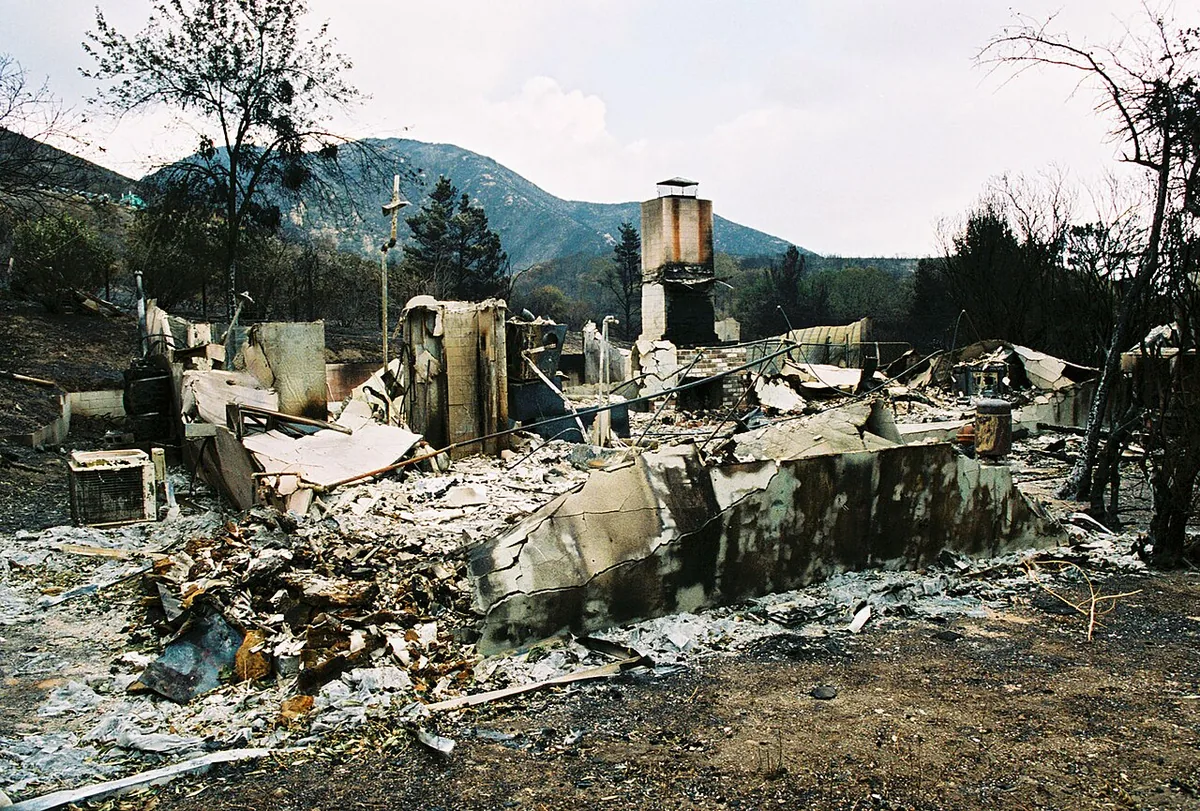
Fire perimeters coloured by decade. Select a perimeter for its name, year and size.
Perimeter sources: NIFC Interagency Fire Perimeter History · WFIGS Interagency Perimeters · largest on record: York 2023. Perimeters are simplified for display; acreage is the figure the source records.
Among the largest cities, typical scored wildfire risk is lower in San Bernardino (21.4), Fontana (21.1), and Ontario (21.1). Rancho Cucamonga is higher at 30.1.
Several mountain and foothill communities are notably higher, including Crestline (70.5), Piñon Hills (70.6), and Lucerne Valley (75.2). Big Bear City is also elevated at 62.5.
Desert and high-desert communities are mixed rather than uniform. Victorville is 48.3, Hesperia is 35.4, and Apple Valley is much higher at 67.4.
The score is the median of the sampled points nearest that community — a community-scale indicator, not a score for any individual property in it. Population comes from the community's own record where the source carries one.
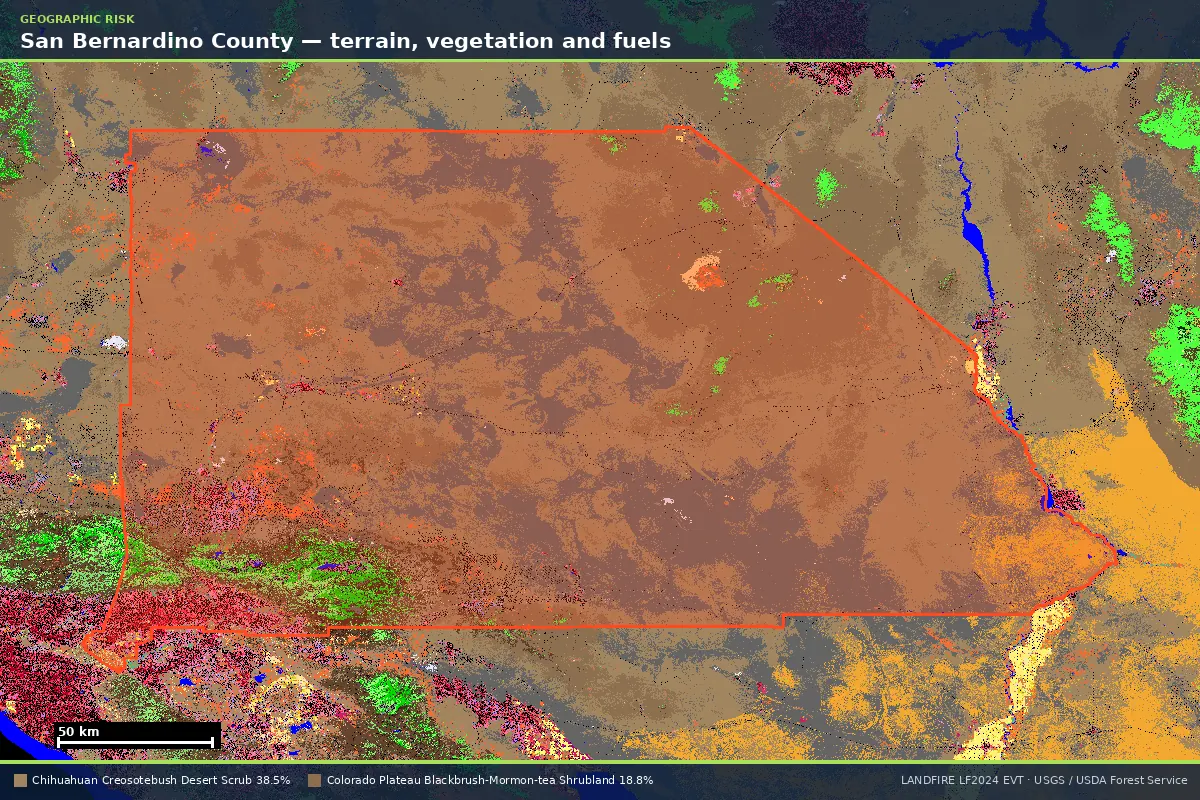
Terrain contributes strongly to wildfire risk in this county. Terrain scores are generally elevated, with a county midpoint of 65.0 and a top scored value of 65.0 at Yucca Valley.
Vegetation and fuels are also elevated in many places. The midpoint is 74.3, with a high of 80.0 at Joshua Tree and a low of 20.0 at San Bernardino.
State hazard-zone scoring varies widely by location, from 10.0 at Mentone to 95.0 at Apple Valley. That spread lines up with why risk can differ so sharply from one community to another.
Fire-history scoring is low in many places but high in some, with a midpoint of 5.0 and a high of 95.0 at Yucca Valley. Past burn patterns are one of the factors associated with current wildfire risk levels.
Fire weather was measured across the county and is elevated in many scored locations. Scores run from 54.8 at Yucca Valley to 83.3 near Fort Irwin, with a midpoint of 68.0.
A separate federal model, the USFS Wildfire Risk to Communities product, reports a mean annual burn probability of 0.40% for the county. Its 90th-percentile cell value is 0.64%.
That same USFS model indicates 87.5% of the county is in areas that can burn. This burn-probability model is useful context, but it is different from local fire-weather scoring.
Risk can change a lot across nearby places. At the low end of scored locations are places like Fontana at 21.1, while the highest scored location is Apple Valley at 84.8.
Higher typical scores appear in several mountain and high-desert communities, including Wrightwood (73.7) and Running Springs (71.8). Lower typical scores appear in parts of the Inland Empire, including Ontario (21.1).
There are also mid-to-higher communities such as Redlands (51.2) and Chino Hills (59.2), showing that wildfire risk is not just a mountain-only pattern.
Each bar is what one part of the score covers across San Bernardino County, on the same 0–100 scale. A long bar is a part of the risk that depends on where you are; a short one is the same almost everywhere.
The tick on each bar is the middle value. Tier boundaries — Moderate at 25, High at 50, Very High at 75 — are the faint lines behind them.
| Layer | Min | Median | Max | Lowest place | Highest place | Points |
|---|---|---|---|---|---|---|
| Terrain | 20 | 65 | 65 | unincorporated San Bernardino County | Yucca Valley | 202 |
| Vegetation & fuels | 20 | 74.3 | 80 | San Bernardino | Joshua Tree | 202 |
| Hazard zone | 10 | 24.2 | 95 | Mentone | Apple Valley | 202 |
| Fire history | 5 | 5 | 95 | unincorporated San Bernardino County | Yucca Valley | 202 |
| Fire weather | 54.8 | 68 | 83.3 | Yucca Valley | near Fort Irwin | 202 |
| Composite | 21.1 | 49.1 | 84.8 | Fontana | Apple Valley | 202 |
Independently of Satelife's layers, the USFS Wildfire Risk to Communities grid puts the county's mean annual burn probability at 0.40% (90th percentile cell: 0.64%), with a mean conditional flame length of 3.72 ft. 88% of the 28,832 grid cells inside the county carry burnable fuel at all.
Source: USFS Wildfire Risk to Communities v2.0 (ImageServer, county extent).
CAL FIRE has no mapped Fire Hazard Severity Zone at 116 of the 202 sampled points — the zones cover Local Responsibility Areas, and most of this county is state or federal land. At 63 of them the USFS grid above supplied the hazard reading instead; at the remaining 53 the hazard weight is renormalised away rather than scored as low.
202 sample points on a ~2.3 km grid, plus one at the centre of each community, weighted with the Satelife county profile v1 · median layer coverage 100%. Scores are 0–100 and comparable within the county, not across states.
For a home-level decision, the key point is local variation: nearby communities can sit in different tiers and score bands. For example, Lake Arrowhead is 57.9 while Running Springs is 71.8.
Countywide, the scored range of 21.1 to 84.8 means two properties in the same broad market area can face different wildfire-risk profiles. That is why address-specific scoring matters for pricing conversations and disclosure context.
If you are comparing homes, use the four-tier result for each address as the primary summary, then look at the underlying factors like terrain, fuels, fire history, and fire weather to understand what is contributing to that tier.
Find out where your San Bernardino County parcel sits
Slope, the fuel touching the structure, the road out, the fire history within a mile — measured at your address, not averaged across the county.
Free to request · PDF report with a 0–100 score, the drivers behind it, and a mitigation plan
Every one of the 129 ZIP areas that touch San Bernardino County — we run address-level reports in all of them. They are grouped by the median score of the points we sampled inside each, which is a neighbourhood-scale indicator and not a score for any property: two homes in the same ZIP routinely land in different tiers.
Very High 1 ZIP
High 28 ZIPs
Moderate 25 ZIPs
Low 10 ZIPs
No sampled point inside 65 ZIPs
85344 Big River · 86403 Big River · 86404 Needles · 86406 Big River · 86436 Needles · 86440 Needles · 89029 Needles · 89046 · 91701 Rancho Cucamonga · 91708 Chino · 91711 Montclair · 91737 Rancho Cucamonga · 91739 Rancho Cucamonga · 91752 Rancho Cucamonga · 91761 Ontario · 91762 Ontario · 91765 Chino Hills · 91766 Chino Hills · 91767 Montclair · 91784 Upland · 92220 Yucaipa · 92223 Yucaipa · 92225 · 92239 · 92267 Big River · 92278 Twentynine Palms · 92282 Morongo Valley · 92304 · 92320 Yucaipa · 92322 Crestline · 92328 · 92333 Big Bear Lake · 92336 Fontana · 92337 Fontana · 92339 Big Bear Lake · 92341 Running Springs · 92368 Helendale · 92369 Highland · 92377 Rialto · 92385 Rimforest · 92386 Big Bear City · 92389 · 92392 Oak Hills · 92394 Adelanto · 92404 Rimforest · 92405 San Bernardino · 92407 Crestline · 92408 Loma Linda · 92410 San Bernardino · 92411 San Bernardino · 92415 San Bernardino · 92501 Grand Terrace · 92507 Grand Terrace · 92509 Bloomington · 92821 Chino Hills · 92823 Chino Hills · 92880 Chino · 92886 Chino Hills · 92887 Chino Hills · 93516 Silver Lakes · 93528 · 93535 Piñon Hills · 93544 Piñon Hills · 93555 Argus · 93591 Piñon Hills
Grouped from 64 of 129 ZIP areas — the rest had no sample point fall inside them. The community shown is the nearest mapped place to the ZIP's centre.
ZIP areas are Census 2020 ZIP Code Tabulation Areas intersecting the county boundary.
Since 1984, 915,062 acres have burned in San Bernardino County, which is 7.1% of the county area.
The largest fire listed here is York (2023) at 93,078 acres. The most recent large fire is Gold (2025).
Yes. The Old fire (2003) is listed with 1,003 structures destroyed.
FEMA’s National Risk Index rates San Bernardino County “Very High” for wildfire risk and “Very High” for expected annual wildfire loss.
Yes. Fire-weather scores were measured across the county, from 54.8 to 83.3 in the scored locations. Separately, the USFS model reports a mean annual burn probability of 0.40% and a 90th-percentile value of 0.64%.
A county range shows the spread. An address-level Satelife report shows where in that spread your property actually sits — PDF, per-layer score, and a prioritized mitigation plan.
Start with your address →