Wildfire risk in San Luis Obispo County: where it is highest, and why
Wildfire risk in San Luis Obispo County varies a lot by location. The overall score runs from 15.0 near Oceano to 82.3 near Nipomo, with a county midpoint of 60.5.
San Luis Obispo County — the largest fires on record, at their perimeter centres, with the county’s main communities. Select a marker for its detail.
At a glance
Half of San Luis Obispo County scores High or worse
We scored 172 points across San Luis Obispo County on the same 0–100 scale a Satelife address report uses, and they do not land in one place. 8% of them come out Very High, while 9% are Low. Which end your own parcel sits at is not something a county map can tell you.
64%
19%
Very High8% · 14 of 172 pointsHigh64% · 110 of 172 pointsModerate19% · 33 of 172 pointsLow9% · 15 of 172 points
Safest end we measured15near Oceano · Low
Middle of the county60.5High — half of San Luis Obispo County is above this
Most exposed end we measured82.3near Nipomo · Very High
And the federal models agree it is a fire county
Relatively HighFEMA National Risk Index — wildfire risk rating · index score 98.3 / 100
$17.4M / yrFEMA NRI — expected annual loss from wildfire · rated Relatively High
1.66%USFS Wildfire Risk to Communities — mean annual burn probability · 90th-percentile cell 3.91%
5.71 ftUSFS WRC — mean conditional flame length · 91% of the county carries burnable fuel
FEMA NRI also rates San Luis Obispo County: all-hazards risk Relatively High · social vulnerability Relatively Low · community resilience Very High · annualised wildfire frequency 0.0081.
Sources: FEMA National Risk Index 1.20.0 (Dec 2025), county record · USFS Wildfire Risk to Communities v2.0, mean of the grid cells inside the county. Both describe the county as a whole, never an address in it.
What does your San Luis Obispo County address score?
A county range shows the spread. Your parcel sits somewhere inside it — the report says where, and what to do about it.
Free to request · PDF report with a 0–100 score, the drivers behind it, and a mitigation plan
Local context
What the data says about San Luis Obispo County
Most places we scored fall in the High tier (110 points), with fewer in Very High (14 points). FEMA’s National Risk Index rates the county’s wildfire risk as Relatively High, and its expected annual wildfire loss rating as Relatively High.
Fire record
Where the fires actually were
Since 1984, fire perimeters in San Luis Obispo County total 714,813 acres across 396 fires. That equals 31% of the county having burned since 1984.
The largest fire listed is Gifford (2025), at 131,614 acres. The most recent large fire is Hwy 46 E On Ramp / Hwy 41 N Off Ramp (2026).
This county summary does not provide structure-destruction counts, and Camp (2018) is specifically flagged without that detail.
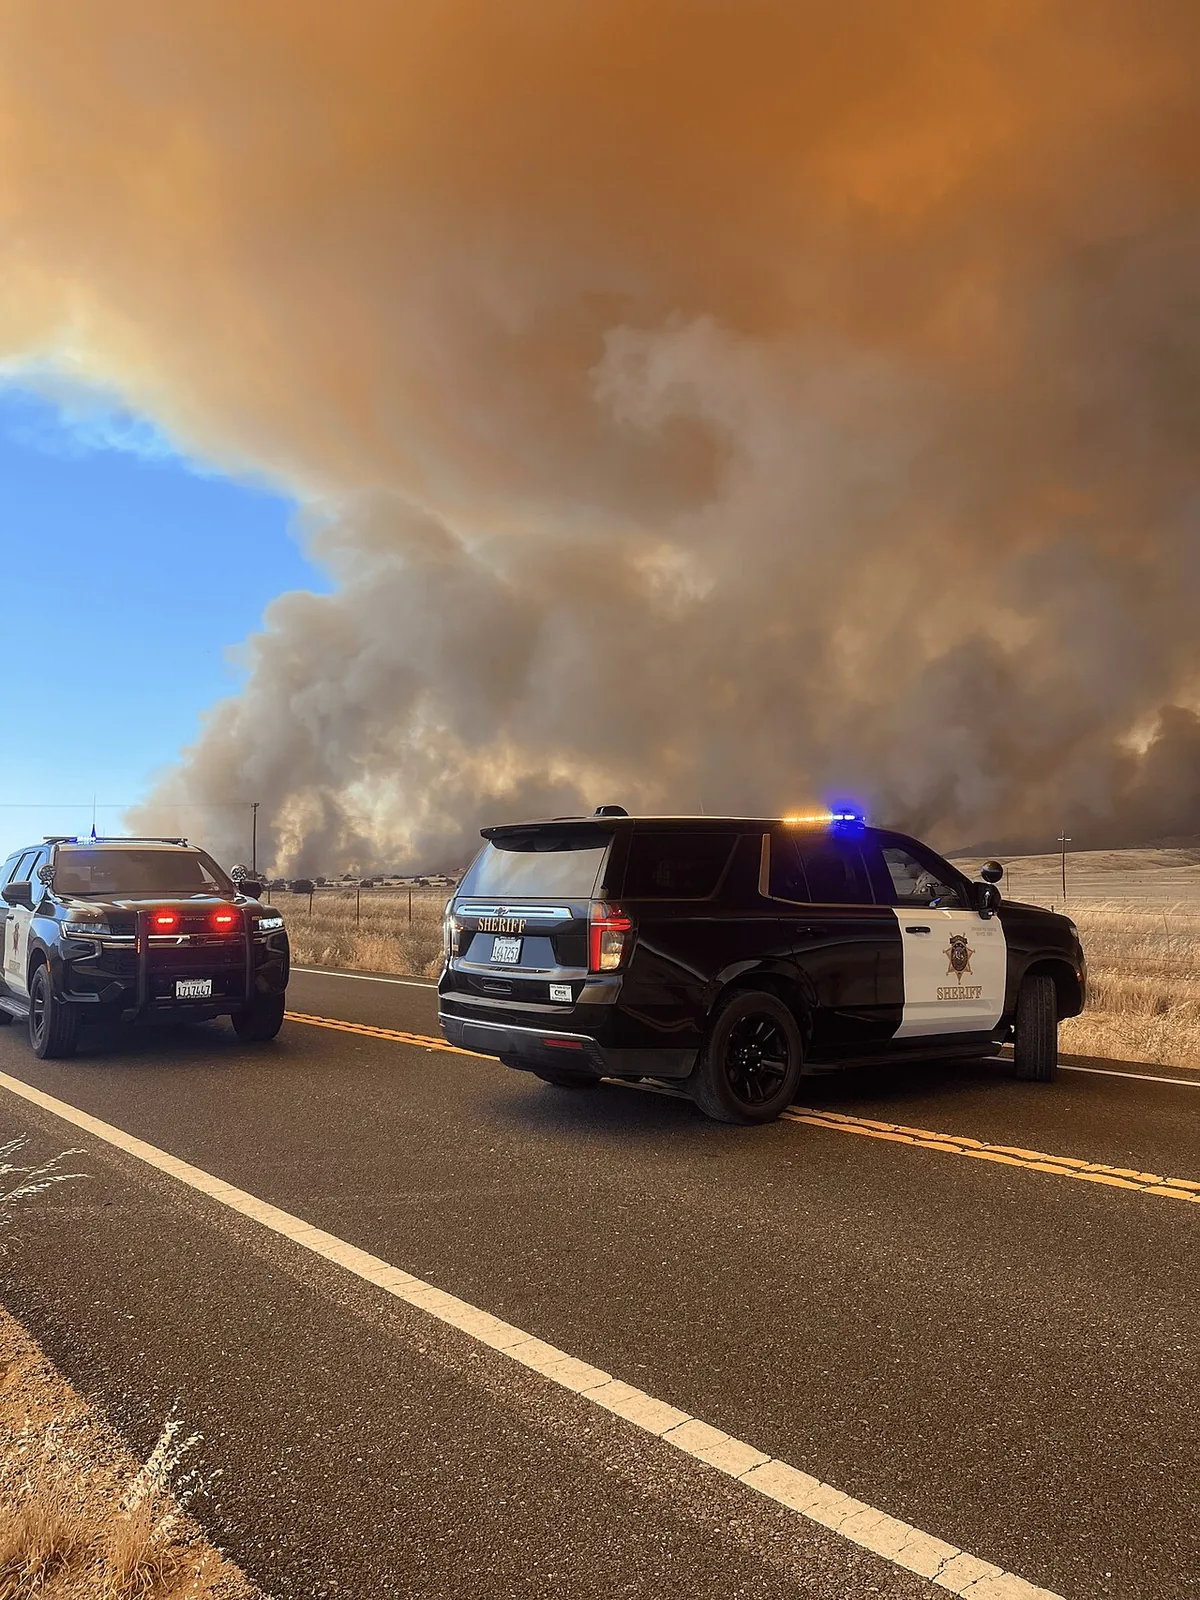
Madre Fire, 2025 — San Luis Obispo County.
Photo: U.S. Forest Service in conjunction with the San Luis Obispo County Sheriff's Office · Public domain
396mapped fire perimeters centred in the county since 1984
714,813acres inside those perimeters since 1984
31.0%of the county's area, as a share of 9,318.4 km²
Hwy 46 E On Ramp / Hwy 41 N Off Ramp 2026most recent large fire on record
Before 20002000s2010s2020s
Fire perimeters coloured by decade. Select a perimeter for its name, year and size.
Named fires on record
Gifford Fire2025131,614 acres
Madre Fire202580,779 acres
Highway 58 Fire1996106,970 acres
Chimney Fire201646,234 acres
Las Pilitas Fire198584,271 acres
Logan Fire199749,490 acres
Weferling Fire196051,451 acres
Hwy 41 Fire199450,729 acres
Perimeter sources: NIFC Interagency Fire Perimeter History · WFIGS Interagency Perimeters · largest on record: Gifford 2025.
Perimeters are simplified for display; acreage is the figure the source records.
Communities
Where in the county you are matters most
Among named communities, higher overall medians appear in San Miguel (71.7), Heritage Ranch (69.1), and Paso Robles (63.8).
Lower medians appear in Morro Bay (17.8), Baywood Park (17.9), and Oceano (19.1).
San Luis Obispo sits near the middle at 55.8, while Atascadero is higher at 62.4 and Arroyo Grande is lower at 51.5.
San Miguelvillage · 3,172 people
71.7 High
Heritage Ranchvillage
69.1 High
Paso Roblestown · 29,793 people
63.8 High
Atascaderotown · 30,330 people
62.4 High
Los Ososvillage
61.8 High
Shandonvillage · 1,168 people
61.3 High
Crestonvillage
57.8 High
San Luis Obispocity · 47,339 people
55.8 High
San Simeonvillage
55.2 High
Arroyo Grandetown · 18,441 people
51.5 High
12 more communities in San Luis Obispo County
Templetontown
51.1 High
Nipomovillage
51.1 High
Cayucosvillage
48.2 Moderate
Cambriatown · 6,032 people
41.9 Moderate
Pismo Beachvillage · 8,072 people
38.2 Moderate
Avila Beachvillage · 1,697 people
35.9 Moderate
Grover Beachtown · 12,701 people
20.2 Low
Shell Beachvillage
20.2 Low
Oceanovillage · 7,183 people
19.1 Low
Baywood Parkvillage
17.9 Low
Cuesta-by-the-Seavillage
17.9 Low
Morro Baytown · 10,135 people
17.8 Low
The score is the median of the sampled points nearest that community — a community-scale
indicator, not a score for any individual property in it. Population comes from the
community's own record where the source carries one.
Terrain & fuels
Terrain, vegetation and fuels
Terrain-related scores run from 20.0 near Nipomo to 65.0 in unincorporated San Luis Obispo County, with a midpoint of 40.0. More difficult terrain is associated with higher wildfire exposure in some areas.
Vegetation and fuels range from 5.0 near Oceano to 80.0 near Nipomo, with a midpoint of 65.0. Heavier fuels contribute to higher wildfire risk where these scores are higher.
Hazard-zone scores span 10.0 near Oceano to 96.0 near Nipomo, with a midpoint of 70.0.
Fire-history scores span 5.0 near Oceano to 95.0 in unincorporated San Luis Obispo County, with a midpoint of 50.0.
40median terrain score (max 65 near unincorporated San Luis Obispo County)
65median vegetation & fuels score (max 80 near Nipomo)
Fire weather
Fire weather across San Luis Obispo County
Fire-weather scores are relatively tight across this county: 51.9 near Nipomo to 63.0 near Shandon, with a midpoint of 53.6.
Separately, the USFS Wildfire Risk to Communities model shows a mean annual burn probability of 1.66% and a 90th-percentile cell value of 3.91%. That is modeled burn probability, not a fire-weather rating.
51.9lowest fire-weather score — near Nipomo
63highest fire-weather score — near Shandon
What drives it
Which part of the risk moves, and which doesn't
Risk is not uniform across the county. The lowest overall score appears near Oceano at 15.0, while the highest appears near Nipomo at 82.3.
High is the most common tier in the places we scored, with 110 points, followed by Moderate with 33.
Low (15) and Very High (14) are both present, so neighborhoods in the same county can face very different wildfire risk levels.
Each bar is what one part of the score covers across San Luis Obispo County, on the same 0–100 scale.
A long bar is a part of the risk that depends on where you are; a short one is the same
almost everywhere.
Terrain
20–65highest near unincorporated San Luis Obispo County
Vegetation & fuels
5–80highest near Nipomo
Hazard zone
10–96highest near Nipomo
Fire history
5–95highest near unincorporated San Luis Obispo County
Fire weather
51.9–63highest near Shandon
Overall score
15–82.3highest near Nipomo
The tick on each bar is the middle value. Tier boundaries — Moderate at 25, High at 50,
Very High at 75 — are the faint lines behind them.
Show every number behind these bars
Layer
Min
Median
Max
Lowest place
Highest place
Points
Terrain
20
40
65
near Nipomo
unincorporated San Luis Obispo County
172
Vegetation & fuels
5
65
80
near Oceano
near Nipomo
172
Hazard zone
10
70
96
near Oceano
near Nipomo
172
Fire history
5
50
95
near Oceano
unincorporated San Luis Obispo County
172
Fire weather
51.9
53.6
63
near Nipomo
near Shandon
172
Composite
15
60.5
82.3
near Oceano
near Nipomo
172
Independently of Satelife's layers, the USFS Wildfire Risk to Communities grid puts the county's mean annual burn probability at 1.66% (90th percentile cell: 3.91%), with a mean conditional flame length of 5.71 ft. 91% of the 21,054 grid cells inside the county carry burnable fuel at all.
Source: USFS Wildfire Risk to Communities v2.0 (ImageServer, county extent).
CAL FIRE has no mapped Fire Hazard Severity Zone at 54 of the 172 sampled points — the zones cover Local Responsibility Areas. At 47 of them the USFS grid above supplied the hazard reading instead; at the remaining 7 the hazard weight is renormalised away rather than scored as low.
172 sample points on a ~2.3 km grid, plus one at the centre of each community, weighted with the Satelife county profile v1 · median layer coverage 100%. Scores are 0–100 and comparable within the county, not across states.
For a property
What a county range means for one address
Property-specific features, such as individual home construction details or parcel-level defensible-space condition, were not measured at all in this county summary.
What is measured is wildfire risk at locations across the county, plus community context. The county midpoint is 60.5, and the most common tier is High with 110 scored points.
At the county scale, 91.4% of land is in places that can burn in the USFS model, and the listed mean annual burn probability is 1.66%. Use that as county background alongside the mapped score for the property’s location.
Across 172 sampled points in San Luis Obispo County, the score runs from
15 to 82.3 — two neighbouring parcels can sit in different tiers.
A county number is the middle of that spread; it says nothing about which end yours is at.
Find out where your San Luis Obispo County parcel sits
Slope, the fuel touching the structure, the road out, the fire history within a mile — measured at your address, not averaged across the county.
Free to request · PDF report with a 0–100 score, the drivers behind it, and a mitigation plan
Coverage
ZIP codes we cover in San Luis Obispo County
Every one of the 32 ZIP areas that touch San Luis Obispo County — we run address-level
reports in all of them. They are grouped by the median score of the points we sampled inside
each, which is a neighbourhood-scale indicator and not a score for any
property: two homes in the same ZIP routinely land in different tiers.
Frequently asked questions about San Luis Obispo County wildfire risk
What does the 0–100 score mean?
It is an overall wildfire-risk score for a location in the county, where higher numbers mean more exposure. In this county, scores range from 15.0 near Oceano to 82.3 near Nipomo.
What tier is most common in San Luis Obispo County?
High is the most common tier in the places we scored, with 110 points. Moderate, Low, and Very High are also present.
What are the key recent fire facts for this county?
Since 1984, 714,813 acres have burned across 396 recorded fire perimeters, equal to 31% of the county. The largest listed fire is Gifford (2025) at 131,614 acres, and the most recent large fire is Hwy 46 E On Ramp / Hwy 41 N Off Ramp (2026).
Is fire weather included here?
Yes. Fire-weather scores are measured in this county and run from 51.9 near Nipomo to 63.0 near Shandon. The USFS burn-probability values are separate modeled burn-probability measures, not fire-weather ratings.
Does FEMA rate this county’s wildfire risk?
Yes. FEMA’s National Risk Index rates San Luis Obispo County’s wildfire risk as Relatively High and its expected annual wildfire loss rating as Relatively High.
This page is generated from a San Luis Obispo County data pack assembled on 2026-08-18 (pack v1.0). Scores are sampled across the
county, not measured at any individual address, and are informational decision support — not a
substitute for official evacuation orders, a fire-agency hazard determination, or an insurer's
underwriting judgement.
Data versions: fema_nri 1.20.0 (Dec 2025) · landfire per adapter · nifc_history All Years View · wfigs current · wrc v2.0 (2024) · zcta Census 2020.
What does your parcel look like, layer by layer?
A county range shows the spread. An address-level Satelife report shows where in that spread your property actually sits — PDF, per-layer score, and a prioritized mitigation plan.