Wildfire risk in Santa Cruz County: where it is highest, and why
Wildfire risk in Santa Cruz County spans a wide range from one place to another. In the places we scored, overall scores run from 14.6 in Davenport to 76.5 in Brookdale, with a county median of 50.8.
Santa Cruz County — the largest fires on record, at their perimeter centres, with the county’s main communities. Select a marker for its detail.
At a glance
Half of Santa Cruz County scores High or worse
We scored 180 points across Santa Cruz County on the same 0–100 scale a Satelife address report uses, and they do not land in one place. 2% of them come out Very High, while 27% are Low. Which end your own parcel sits at is not something a county map can tell you.
50%
22%
27%
Very High2% · 3 of 180 pointsHigh50% · 90 of 180 pointsModerate22% · 39 of 180 pointsLow27% · 48 of 180 points
Safest end we measured14.6near Davenport · Low
Middle of the county50.8High — half of Santa Cruz County is above this
Most exposed end we measured76.5near Brookdale · Very High
And the federal models agree it is a fire county
Relatively ModerateFEMA National Risk Index — wildfire risk rating · index score 97.3 / 100
$9.0M / yrFEMA NRI — expected annual loss from wildfire · rated Relatively High
0.20%USFS Wildfire Risk to Communities — mean annual burn probability · 90th-percentile cell 0.41%
1.76 ftUSFS WRC — mean conditional flame length · 59% of the county carries burnable fuel
FEMA NRI also rates Santa Cruz County: all-hazards risk Relatively High · social vulnerability Relatively Low · community resilience Relatively High · annualised wildfire frequency 0.0045.
Sources: FEMA National Risk Index 1.20.0 (Dec 2025), county record · USFS Wildfire Risk to Communities v2.0, mean of the grid cells inside the county. Both describe the county as a whole, never an address in it.
What does your Santa Cruz County address score?
A county range shows the spread. Your parcel sits somewhere inside it — the report says where, and what to do about it.
Free to request · PDF report with a 0–100 score, the drivers behind it, and a mitigation plan
Local context
What the data says about Santa Cruz County
Most scored points fall in the High tier. High has 90 points, compared with 39 in Moderate and 48 in Low.
For county-wide context, FEMA’s National Risk Index rates Santa Cruz County’s wildfire risk as “Relatively Moderate,” while its wildfire expected annual loss rating is “Relatively High.”
Fire record
Where the fires actually were
The largest fire listed here is the Lockheed fire in 2009 at 7,783 acres. It is also the most recent large fire.
Since 1984, 18,510 acres have burned in the county, which is 4.9% of county area. The records here also show 39 fire perimeters since 1984.
Another major event was the Lexington fire in 1985 at 13,128 acres, and it was partly in Santa Cruz County.
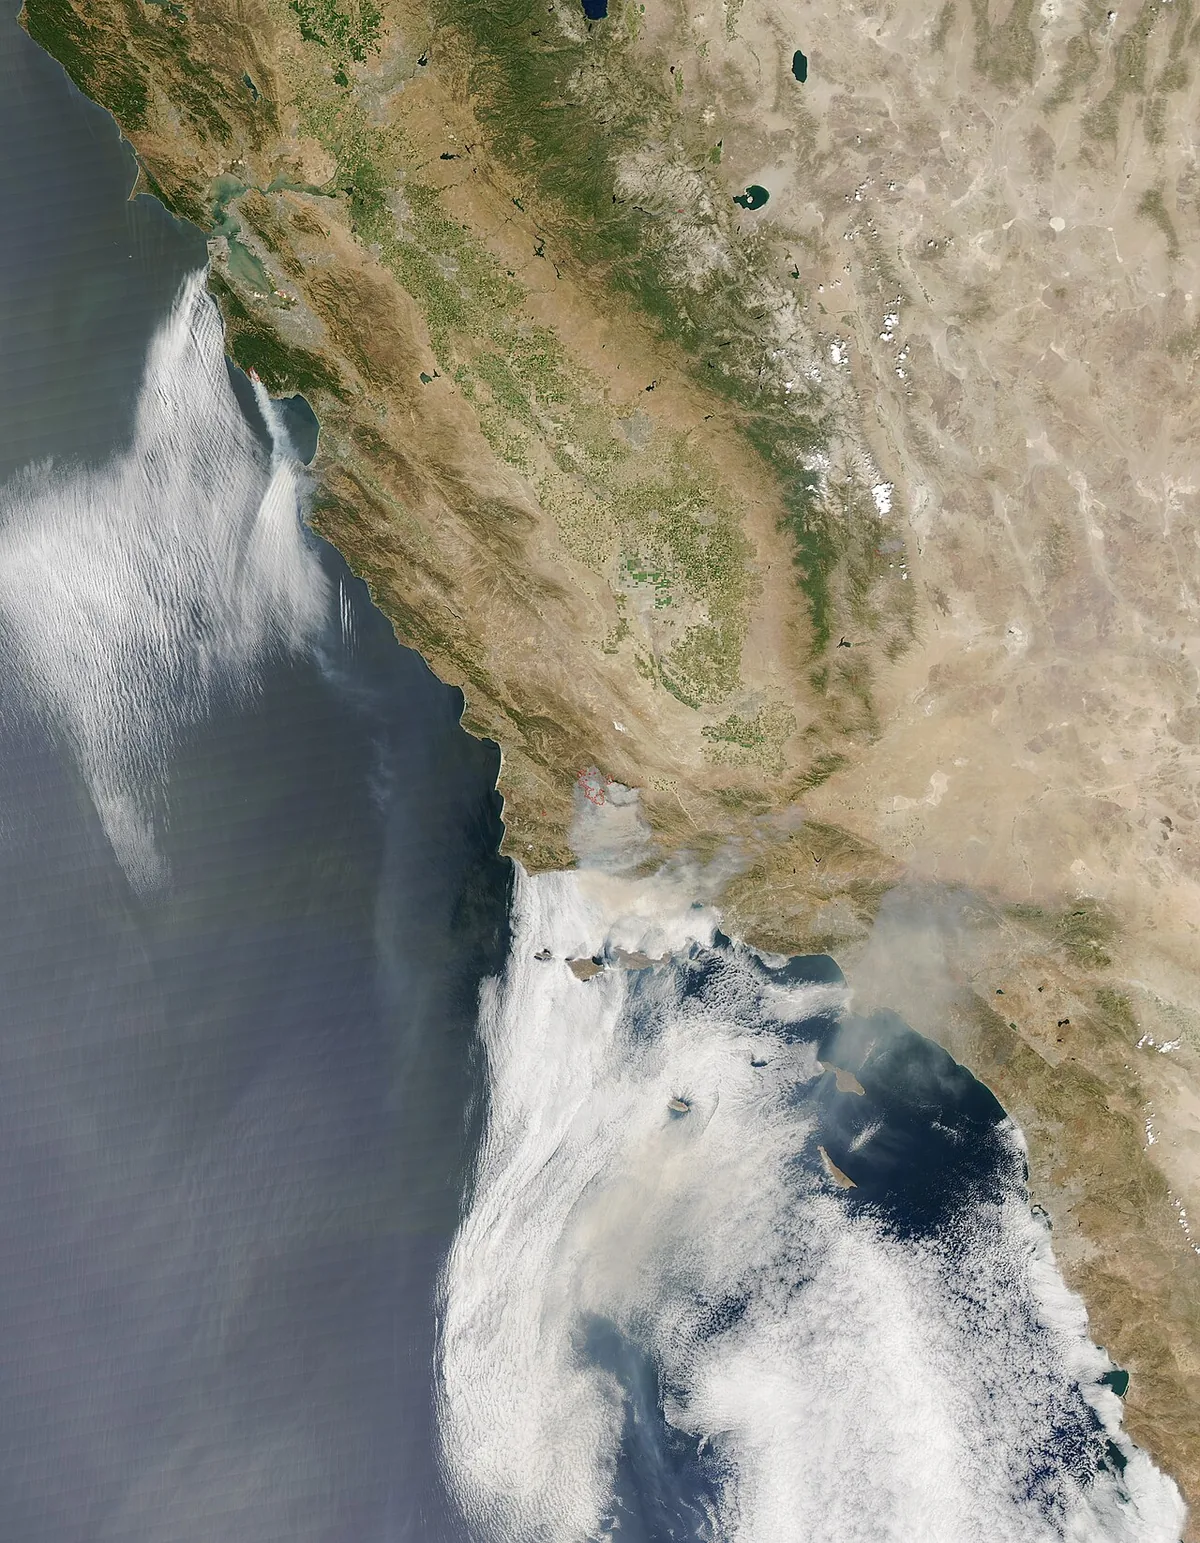
Lockheed Fire, 2009 — Santa Cruz County.
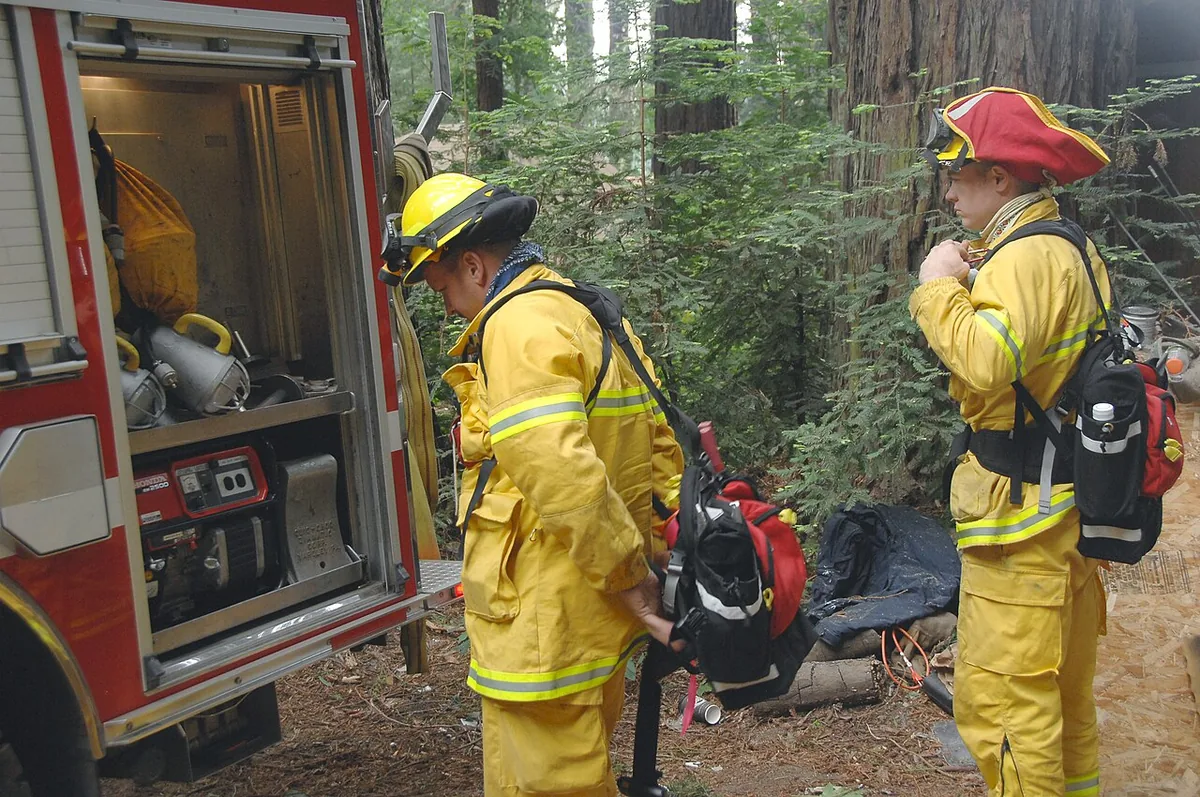
Photo: Jeff Schmaltz · Public domainSummit Fire, 2008 — Santa Cruz County.
Photo: Chief Petty Officer Alan Haraf · Public domain
39mapped fire perimeters centred in the county since 1984
18,510acres inside those perimeters since 1984
4.9%of the county's area, as a share of 1,522.3 km²
Lockheed 2009most recent large fire on record
Before 20002000s2010s2020s
Fire perimeters coloured by decade. Select a perimeter for its name, year and size.
Named fires on record
Lockheed Fire20097,783 acres
Summit Fire20084,175 acres
Lincoln Hill Fire19623,236 acres
Lexington Fire198513,128 acres in totalcrossed into the county
Newell Creek #2 Fire19591,327 acres
Rocha Vmp Escape #2 Fire19841,240 acres
Loma Fire2009669 acres
Trabing Fire2008594 acres
Perimeter sources: NIFC Interagency Fire Perimeter History · largest on record: Lockheed 2009.
Perimeters are simplified for display; acreage is the figure the source records.
Communities
Where in the county you are matters most
Among the larger named places, Scotts Valley is notably higher at 50.4, while Santa Cruz is 20.8 and Watsonville is 17.1.
Several inland villages also score higher, including Day Valley at 60.9, Paradise Park at 59.6, and Felton at 58.7. These differences are why two homes in the same county can sit in different risk tiers.
Brookdalevillage
73.2 High
Boulder Creektown · 4,923 people
66.3 High
Bonny Doonvillage
65.3 High
Day Valleyvillage
60.9 High
Paradise Parkvillage
59.6 High
Feltonvillage
58.7 High
Summit Westvillage
57 High
Aptos Hills-Larkin Valleyvillage
56 High
Corralitosvillage
53.7 High
Lompicovillage
53 High
20 more communities in Santa Cruz County
Happy Valleyvillage
51.8 High
Summitvillage
50.9 High
Scotts Valleytown · 11,150 people
50.4 High
Ben Lomondvillage
45 Moderate
Amestivillage
44.8 Moderate
Davenportvillage
40.3 Moderate
Interlakenvillage
38.3 Moderate
Soquelvillage
26.8 Moderate
Seacliffvillage
26 Moderate
La Selva Beachvillage
25.4 Moderate
Rio Del Marvillage
22.8 Low
Seascapevillage
22.7 Low
Pajaro Dunesvillage
21.9 Low
Santa Cruzcity · 64,220 people
20.8 Low
Capitolatown · 9,507 people
17.8 Low
Live Oaktown · 8,392 people
17.8 Low
Watsonvillecity
17.1 Low
Watsonvilletown · 51,199 people
17.1 Low
Opal Cliffsvillage
15.7 Low
Twin Lakesvillage
15.7 Low
The score is the median of the sampled points nearest that community — a community-scale
indicator, not a score for any individual property in it. Population comes from the
community's own record where the source carries one.
Terrain & fuels
Terrain, vegetation and fuels
Terrain contributes differently across the county. Terrain scores range from 5.0 in Pajaro Dunes to 65.0 in Corralitos, with a median of 40.0.
Vegetation and fuels run higher overall. That layer has a median of 59.1, reaches 80.0 in Bonny Doon, and drops to 5.0 near Twin Lakes.
40median terrain score (max 65 near Corralitos)
59.1median vegetation & fuels score (max 80 near Bonny Doon)
Fire weather
Fire weather across Santa Cruz County
Fire weather was measured across the county and is less spread out than some other factors. Scores run from 50.3 in Davenport to 66.8 in Paradise Park, with a median of 59.3.
Separate from weather, the USFS Wildfire Risk to Communities model shows a mean annual burn probability of 0.20 percent and a 90th-percentile cell value of 0.41 percent. It also indicates 59.2% of the county can burn.
50.3lowest fire-weather score — near Davenport
66.8highest fire-weather score — near Paradise Park
What drives it
Which part of the risk moves, and which doesn't
Risk is generally higher in several mountain and hill communities than along much of the coast. Brookdale has a median score of 73.2, Boulder Creek is 66.3, and Bonny Doon is 65.3.
Lower community medians appear in places like Opal Cliffs at 15.7, Twin Lakes at 15.7, and Watsonville at 17.1.
That local spread matches the countywide pattern: the overall midpoint is 50.8, but values stretch from the mid-teens to the mid-70s depending on location.
Each bar is what one part of the score covers across Santa Cruz County, on the same 0–100 scale.
A long bar is a part of the risk that depends on where you are; a short one is the same
almost everywhere.
Terrain
5–65highest near Corralitos
Vegetation & fuels
5–80highest near Bonny Doon
Hazard zone
10–90highest near Bonny Doon
Fire history
5–95highest near Davenport
Fire weather
50.3–66.8highest near Paradise Park
Overall score
14.6–76.5highest near Brookdale
The tick on each bar is the middle value. Tier boundaries — Moderate at 25, High at 50,
Very High at 75 — are the faint lines behind them.
Show every number behind these bars
Layer
Min
Median
Max
Lowest place
Highest place
Points
Terrain
5
40
65
Pajaro Dunes
Corralitos
180
Vegetation & fuels
5
59.1
80
near Twin Lakes
Bonny Doon
180
Hazard zone
10
70
90
near Twin Lakes
near Bonny Doon
180
Fire history
5
20
95
near Twin Lakes
Davenport
180
Fire weather
50.3
59.3
66.8
Davenport
Paradise Park
180
Composite
14.6
50.8
76.5
Davenport
Brookdale
180
Independently of Satelife's layers, the USFS Wildfire Risk to Communities grid puts the county's mean annual burn probability at 0.20% (90th percentile cell: 0.41%), with a mean conditional flame length of 1.76 ft. 59% of the 19,085 grid cells inside the county carry burnable fuel at all.
Source: USFS Wildfire Risk to Communities v2.0 (ImageServer, county extent).
CAL FIRE has no mapped Fire Hazard Severity Zone at 35 of the 180 sampled points — the zones cover Local Responsibility Areas. At 1 of them the USFS grid above supplied the hazard reading instead; at the remaining 34 the hazard weight is renormalised away rather than scored as low.
180 sample points on a ~2.3 km grid, plus one at the centre of each community, weighted with the Satelife county profile v1 · median layer coverage 100%. Scores are 0–100 and comparable within the county, not across states.
For a property
What a county range means for one address
For property-level context, hazard-zone scores are often elevated in this county. The hazard-zone median is 70.0, with a high of 90.0 near Bonny Doon and a low of 10.0 near Twin Lakes.
Recent and historical fire footprint is another separate contributor. Fire-history scores range from 5.0 near Twin Lakes to 95.0 in Davenport, with a median of 20.0.
At the tier level used for address reports, High is the most common tier in the scored points (90), and there are also Very High locations (3).
Across 180 sampled points in Santa Cruz County, the score runs from
14.6 to 76.5 — two neighbouring parcels can sit in different tiers.
A county number is the middle of that spread; it says nothing about which end yours is at.
Find out where your Santa Cruz County parcel sits
Slope, the fuel touching the structure, the road out, the fire history within a mile — measured at your address, not averaged across the county.
Free to request · PDF report with a 0–100 score, the drivers behind it, and a mitigation plan
Coverage
ZIP codes we cover in Santa Cruz County
Every one of the 25 ZIP areas that touch Santa Cruz County — we run address-level
reports in all of them. They are grouped by the median score of the points we sampled inside
each, which is a neighbourhood-scale indicator and not a score for any
property: two homes in the same ZIP routinely land in different tiers.
Frequently asked questions about Santa Cruz County wildfire risk
What was the most recent large fire in Santa Cruz County?
The most recent large fire listed is the Lockheed fire in 2009, and it is also the largest fire listed here at 7,783 acres.
How much of Santa Cruz County has burned since 1984?
18,510 acres have burned since 1984, which equals 4.9% of the county.
Are coastal places always lower risk than mountain places?
Not always, but the scored places here show a pattern: some mountain communities like Brookdale (73.2) and Boulder Creek (66.3) are higher than coastal communities like Twin Lakes (15.7) and Opal Cliffs (15.7).
What does FEMA say about county-wide wildfire risk?
FEMA’s National Risk Index rates Santa Cruz County’s wildfire risk as “Relatively Moderate,” and its wildfire expected annual loss as “Relatively High.”
This page is generated from a Santa Cruz County data pack assembled on 2026-08-19 (pack v1.0). Scores are sampled across the
county, not measured at any individual address, and are informational decision support — not a
substitute for official evacuation orders, a fire-agency hazard determination, or an insurer's
underwriting judgement.
Data versions: fema_nri 1.20.0 (Dec 2025) · landfire per adapter · nifc_history All Years View · wfigs current · wrc v2.0 (2024) · zcta Census 2020.
What does your parcel look like, layer by layer?
A county range shows the spread. An address-level Satelife report shows where in that spread your property actually sits — PDF, per-layer score, and a prioritized mitigation plan.