Wildfire risk in Shasta County: where it is highest, and why
Shasta County’s wildfire risk is generally elevated in the places we scored. The countywide middle overall score is 65.5, and scores run from 23.7 in Cottonwood up to 79.7 in unincorporated Shasta County.
Shasta County — the largest fires on record, at their perimeter centres, with the county’s main communities. Select a marker for its detail.
At a glance
Half of Shasta County scores High or worse
We scored 162 points across Shasta County on the same 0–100 scale a Satelife address report uses, and they do not land in one place. 11% of them come out Very High, while 1% are Low. Which end your own parcel sits at is not something a county map can tell you.
11%
80%
Very High11% · 18 of 162 pointsHigh80% · 130 of 162 pointsModerate8% · 13 of 162 pointsLow1% · 1 of 162 points
Safest end we measured23.7near Cottonwood · Low
Middle of the county65.5High — half of Shasta County is above this
Most exposed end we measured79.7near unincorporated Shasta County · Very High
And the federal models agree it is a fire county
Relatively HighFEMA National Risk Index — wildfire risk rating · index score 99.5 / 100
$35.4M / yrFEMA NRI — expected annual loss from wildfire · rated Relatively High
1.25%USFS Wildfire Risk to Communities — mean annual burn probability · 90th-percentile cell 2.89%
6.94 ftUSFS WRC — mean conditional flame length · 98% of the county carries burnable fuel
FEMA NRI also rates Shasta County: all-hazards risk Relatively Moderate · social vulnerability Relatively Moderate · community resilience Relatively Moderate · annualised wildfire frequency 0.0088.
Sources: FEMA National Risk Index 1.20.0 (Dec 2025), county record · USFS Wildfire Risk to Communities v2.0, mean of the grid cells inside the county. Both describe the county as a whole, never an address in it.
What does your Shasta County address score?
A county range shows the spread. Your parcel sits somewhere inside it — the report says where, and what to do about it.
Free to request · PDF report with a 0–100 score, the drivers behind it, and a mitigation plan
Local context
What the data says about Shasta County
Most scored locations fall in the High tier: 130 points are High, compared with 18 in Very High. FEMA’s National Risk Index rates Shasta County’s wildfire risk as Relatively High for the county as a whole.
Fire record
Where the fires actually were
Since 1984, 1,043,461 acres have burned in Shasta County, and that equals 42.6% of the county. There have also been 344 fire perimeters recorded since 1984.
The county summary identifies the Carr Fire (2018) as the largest major fire, at 229,686 acres. It destroyed 1,614 structures.
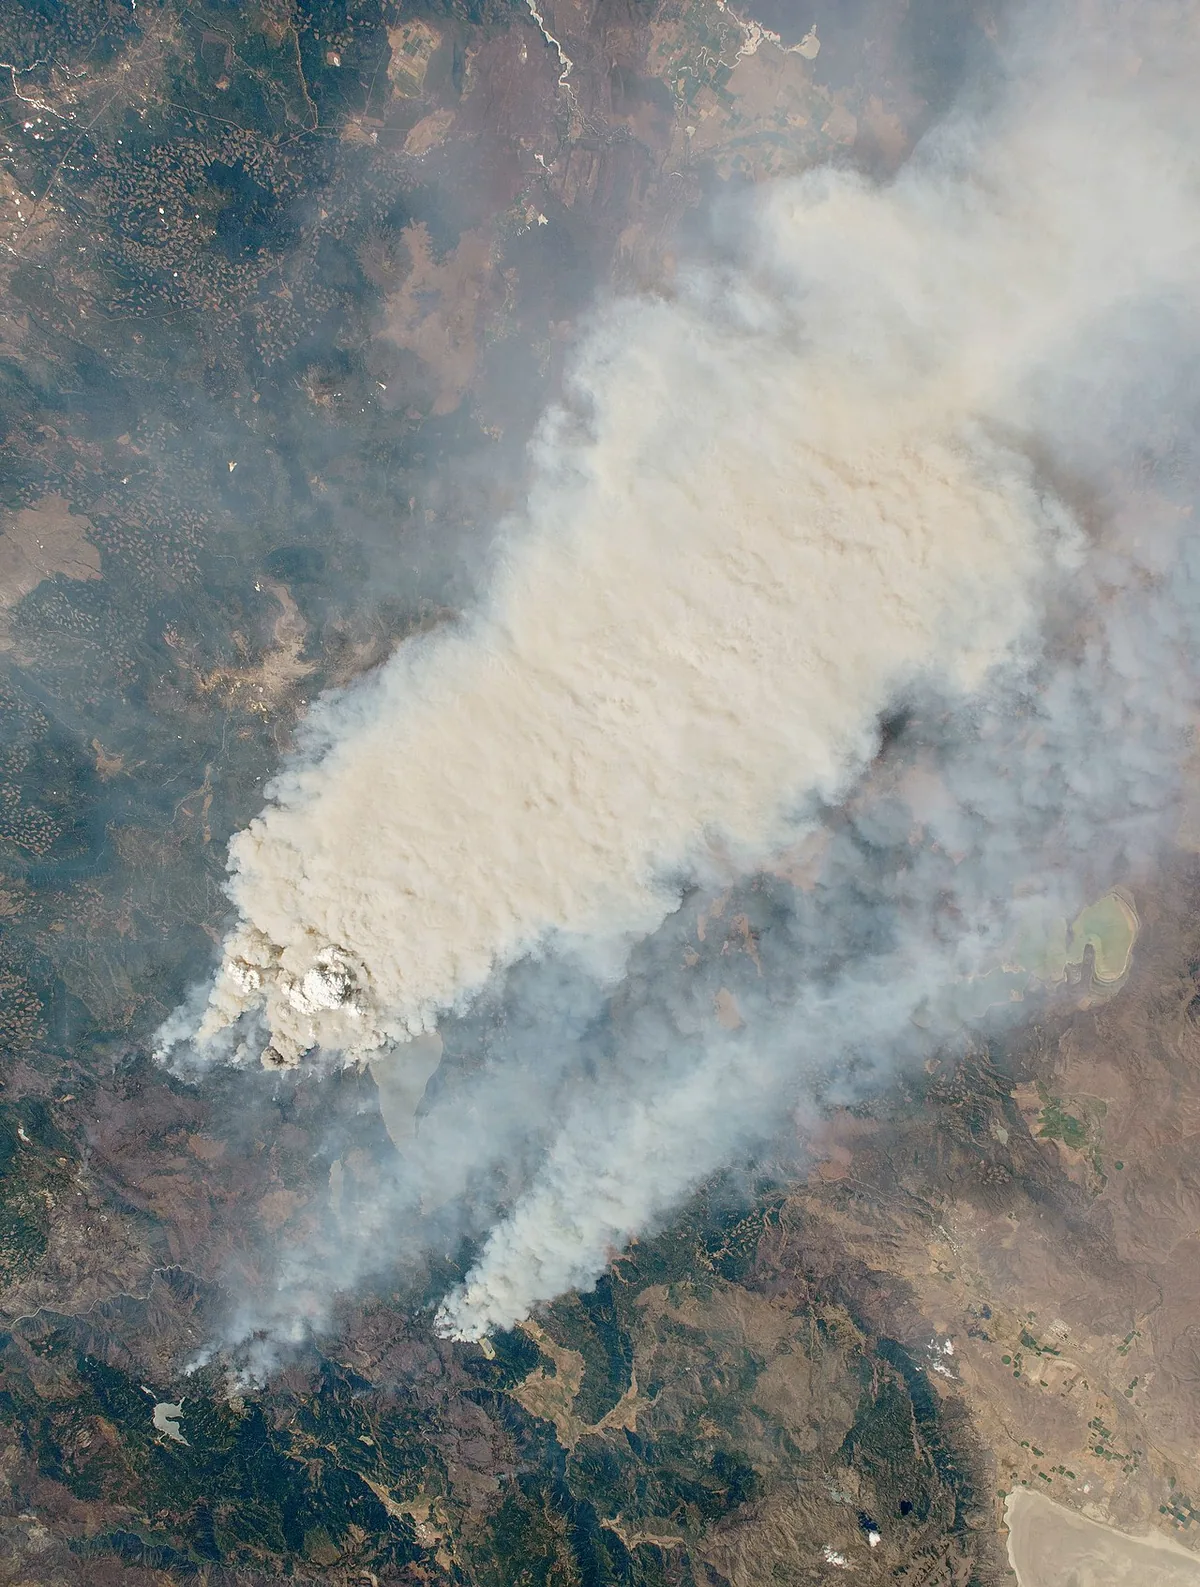
The most recent large fire is Green (2025). Another major incident tied to the county is Dixie (2021), which burned 963,309 acres and was partly in Shasta County.
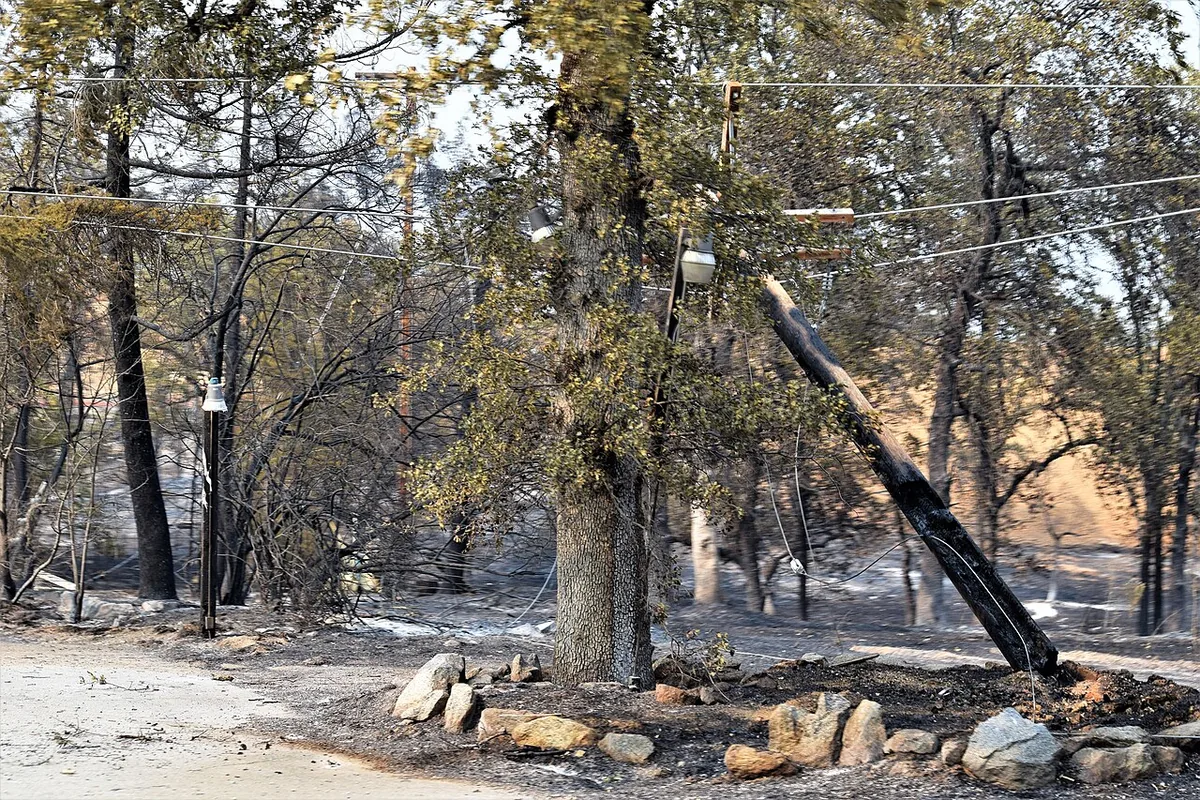
Carr Fire, 2018 — Shasta County.
Photo: blmcalifornia · Public domainDixie Fire, 2021 — Shasta County.
Photo: NASA Earth Observatory · Public domain
344mapped fire perimeters centred in the county since 1984
1,043,461acres inside those perimeters since 1984
42.6%of the county's area, as a share of 9,919.4 km²
Green 2025most recent large fire on record
Before 20002000s2010s2020s
Fire perimeters coloured by decade. Select a perimeter for its name, year and size.
Dixie Fire2021963,309 acres in totalcrossed into the county
Zogg Fire202056,338 acres204 structures destroyed
Delta Fire201863,506 acres
Glass Mountain Fire1910146,968 acres
Hirz Fire201840,608 acres
Bagley Fire201246,040 acres
Jones Fire199926,203 acres954 structures destroyed
Perimeter sources: NIFC Interagency Fire Perimeter History · WFIGS Interagency Perimeters · largest on record: Carr 2018.
Perimeters are simplified for display; acreage is the figure the source records.
Communities
Where in the county you are matters most
Among named communities, several villages and towns score in the upper range: Bella Vista is 68.9, Fall River Mills is 68.1, and Old Station is 67.3.
Lower-scoring communities are present too. Cottonwood is 29.3, Redding is 40.9, and Anderson is 57.7, showing meaningful neighborhood-to-neighborhood variation across the county.
Bella Vistavillage
68.9 High
Fall River Millsvillage
68.1 High
Old Stationvillage
67.3 High
Shasta Laketown · 10,228 people
66.1 High
Shingletownvillage
65.9 High
Big Bendvillage
65 High
Burneyvillage · 3,200 people
64.3 High
Millvillevillage · 724 people
61.1 High
Andersontown · 10,418 people
57.7 High
Palo Cedrotown
55.7 High
2 more communities in Shasta County
Reddingcity · 91,582 people
40.9 Moderate
Cottonwoodvillage
29.3 Moderate
The score is the median of the sampled points nearest that community — a community-scale
indicator, not a score for any individual property in it. Population comes from the
community's own record where the source carries one.
Terrain & fuels
Terrain, vegetation and fuels
Terrain contributes to higher wildfire risk in much of the county, but local differences are limited in this layer. Terrain scores run from 40.0 in unincorporated Shasta County to 65.0 in Shingletown.
Vegetation and fuels vary more by place. This score is 20.0 in Redding and reaches 80.0 in unincorporated Shasta County, with a county middle value of 70.0.
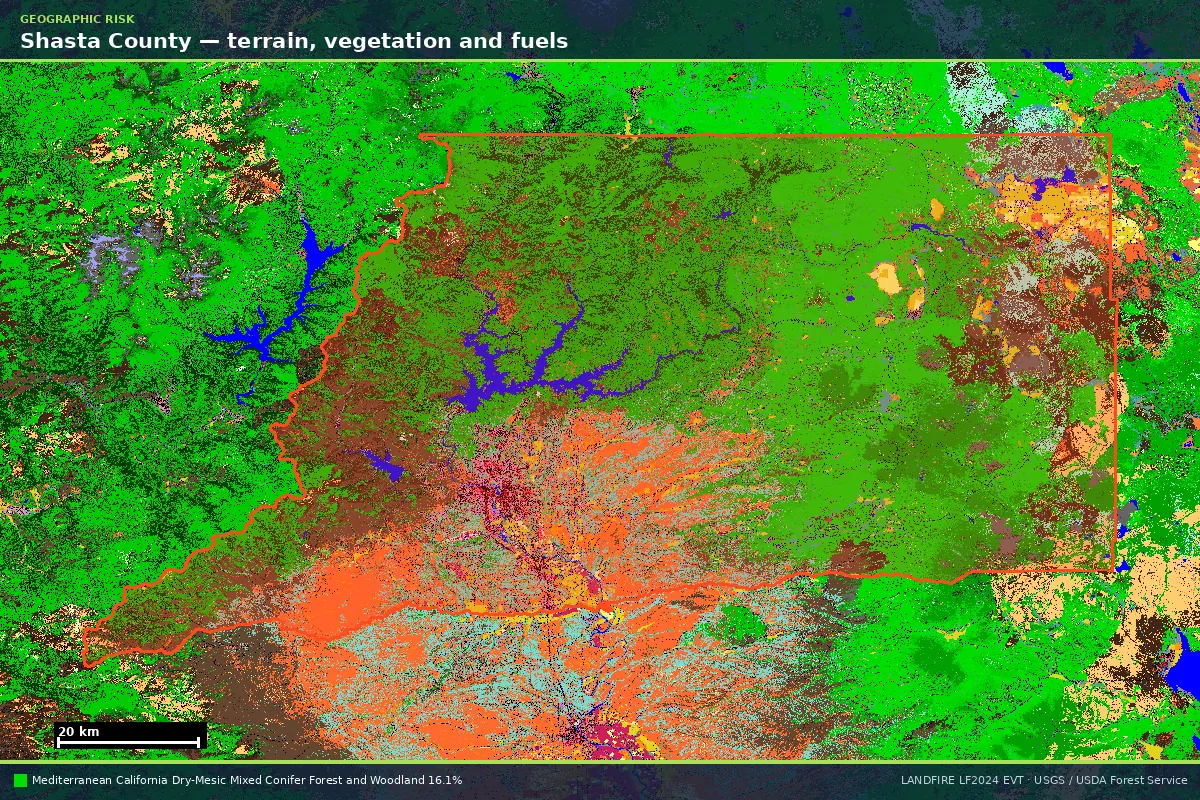
LANDFIRE existing vegetation type across Shasta County — the same fuel data that feeds the
vegetation layer of a Satelife property report.
Fire weather
Fire weather across Shasta County
Fire-weather exposure is consistently high across the places scored in Shasta County. Scores stay in a tight band, from 54.9 in unincorporated Shasta County to 57.1 in Cottonwood.
A separate USFS model estimates mean annual burn probability at 1.25%, with 2.89% at the 90th-percentile cell. It also indicates 98.3% of the county can burn; this is modeled burn probability, not fire weather.
54.9lowest fire-weather score — near unincorporated Shasta County
57.1highest fire-weather score — near Cottonwood
What drives it
Which part of the risk moves, and which doesn't
Wildfire risk is not the same from one part of the county to another. Among the places scored, Cottonwood is at the low end at 23.7, while unincorporated Shasta County reaches 79.7.
Community patterns show the same spread. Bella Vista scores 68.9 and Shasta Lake 66.1, while Redding is lower at 40.9.
Each bar is what one part of the score covers across Shasta County, on the same 0–100 scale.
A long bar is a part of the risk that depends on where you are; a short one is the same
almost everywhere.
Terrain
40–65highest near Shingletown
Vegetation & fuels
20–80highest near unincorporated Shasta County
Hazard zone
10–96highest near Bella Vista
Fire history
5–95highest near unincorporated Shasta County
Fire weather
54.9–57.1highest near Cottonwood
Overall score
23.7–79.7highest near unincorporated Shasta County
The tick on each bar is the middle value. Tier boundaries — Moderate at 25, High at 50,
Very High at 75 — are the faint lines behind them.
Show every number behind these bars
Layer
Min
Median
Max
Lowest place
Highest place
Points
Terrain
40
65
65
unincorporated Shasta County
Shingletown
162
Vegetation & fuels
20
70
80
Redding
unincorporated Shasta County
162
Hazard zone
10
90
96
Cottonwood
near Bella Vista
162
Fire history
5
60
95
near Cottonwood
unincorporated Shasta County
162
Fire weather
54.9
56.6
57.1
unincorporated Shasta County
Cottonwood
162
Composite
23.7
65.5
79.7
Cottonwood
unincorporated Shasta County
162
Independently of Satelife's layers, the USFS Wildfire Risk to Communities grid puts the county's mean annual burn probability at 1.25% (90th percentile cell: 2.89%), with a mean conditional flame length of 6.94 ft. 98% of the 27,106 grid cells inside the county carry burnable fuel at all.
Source: USFS Wildfire Risk to Communities v2.0 (ImageServer, county extent).
CAL FIRE has no mapped Fire Hazard Severity Zone at 57 of the 162 sampled points — the zones cover Local Responsibility Areas. At 57 of them the USFS grid above supplied the hazard reading instead.
162 sample points on a ~2.3 km grid, plus one at the centre of each community, weighted with the Satelife county profile v1 · median layer coverage 100%. Scores are 0–100 and comparable within the county, not across states.
For a property
What a county range means for one address
State hazard-zone mapping is high in many scored areas. The middle hazard-zone score is 90.0, with a low of 10.0 in Cottonwood and a high of 96.0 near Bella Vista.
Past fire footprint is also uneven. Fire-history scores range from 5.0 near Cottonwood to 95.0 in unincorporated Shasta County, with a middle value of 60.0.
For property-level context, the county’s scored points cluster in the High tier. There are 130 High points, 18 Very High points, and just 1 Low point.
Across 162 sampled points in Shasta County, the score runs from
23.7 to 79.7 — two neighbouring parcels can sit in different tiers.
A county number is the middle of that spread; it says nothing about which end yours is at.
Find out where your Shasta County parcel sits
Slope, the fuel touching the structure, the road out, the fire history within a mile — measured at your address, not averaged across the county.
Free to request · PDF report with a 0–100 score, the drivers behind it, and a mitigation plan
Coverage
ZIP codes we cover in Shasta County
Every one of the 36 ZIP areas that touch Shasta County — we run address-level
reports in all of them. They are grouped by the median score of the points we sampled inside
each, which is a neighbourhood-scale indicator and not a score for any
property: two homes in the same ZIP routinely land in different tiers.
Frequently asked questions about Shasta County wildfire risk
Is wildfire risk basically the same everywhere in Shasta County?
No. Scores range from 23.7 in Cottonwood to 79.7 in unincorporated Shasta County, so location inside the county matters a lot.
What does FEMA say about wildfire risk here?
FEMA’s National Risk Index rates Shasta County’s wildfire risk as Relatively High, and its wildfire expected annual loss rating is also Relatively High.
How much of Shasta County has burned in recent decades?
Since 1984, 1,043,461 acres have burned, which is 42.6% of the county.
What is the most recent large fire?
The most recent large fire is Green (2025).
Which major fire destroyed the most structures in the list here?
Carr (2018) destroyed 1,614 structures. Other listed destructive fires include Jones (1999), which destroyed 954 structures, and Zogg (2020), which destroyed 204.
This page is generated from a Shasta County data pack assembled on 2026-08-18 (pack v1.0). Scores are sampled across the
county, not measured at any individual address, and are informational decision support — not a
substitute for official evacuation orders, a fire-agency hazard determination, or an insurer's
underwriting judgement.
Data versions: fema_nri 1.20.0 (Dec 2025) · landfire per adapter · nifc_history All Years View · wfigs current · wrc v2.0 (2024) · zcta Census 2020.
What does your parcel look like, layer by layer?
A county range shows the spread. An address-level Satelife report shows where in that spread your property actually sits — PDF, per-layer score, and a prioritized mitigation plan.